The MPBSpread Decision Support Tool
PROJECT TEAM
Dr. Allan Carroll, PhD
Dr. Brad Seely, PhD
Dr. Clive Welham, PhD
Arnold Moy, MSc
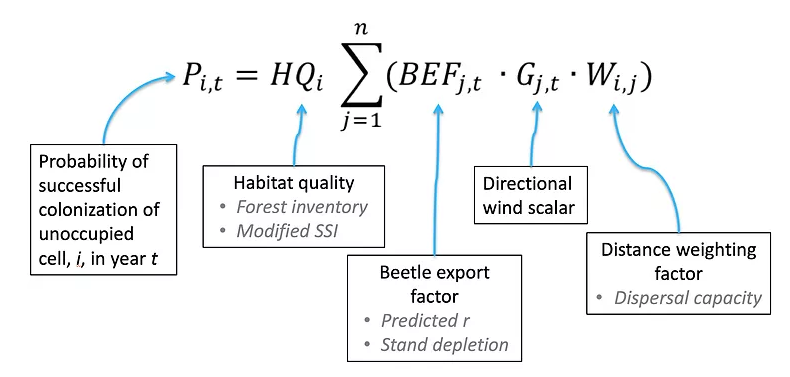
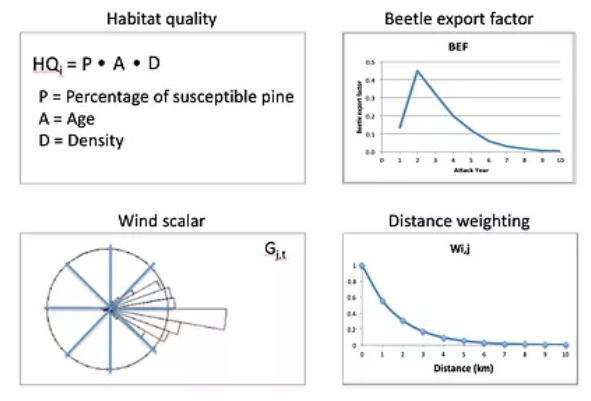
The MPBSpread model calculates the probability of a successful colonization of an unoccupied cell in a given year based upon the following equation:
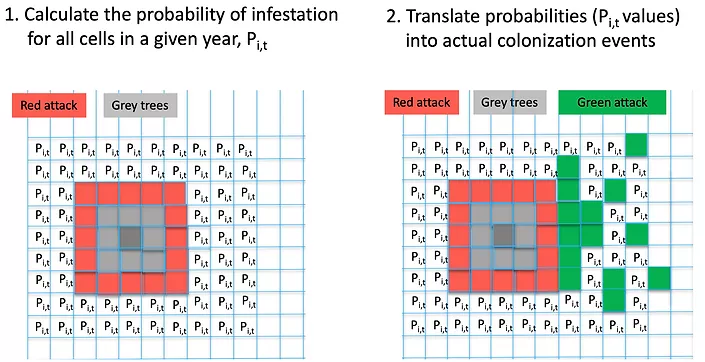
The MPBSpread model employs a cell-based approach to simulation using 400m* 400m cells (16ha). The following figures illustrate that approach:
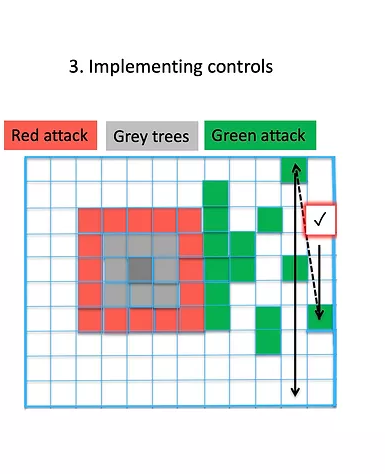
Implementation rules:
- Level 1: Cells where an infestation is detected with < 3 years of establishment.
- Level 2: Cells with infestations of >2 years duration and < 7km from a road. Else, no treatment.
Application rules (leading edge focus):
- Begin with easternmost longitude and highest latitude within study area
- Proceed sequentially westward
- Continue until all cells within the study are have been sampled or the total area allocated for control in a given year is reached.
Notes:
- Each infested cell has a probability of (i) being detected, and (ii) successfully eradicated (Peradicate).
- Level1: all or a proportion of green attack is removed, set by Peradicate
- Level 2: All trees are removed
The MPBSpread model was validated using an extensive data set from neighbouring British Columbia:
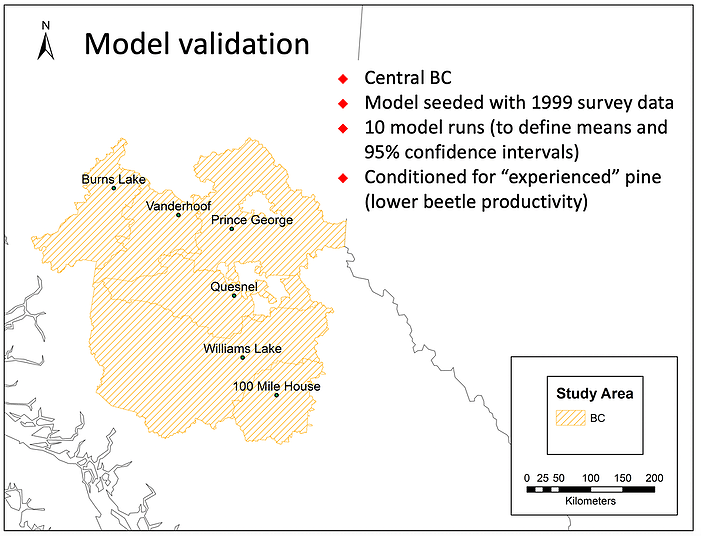
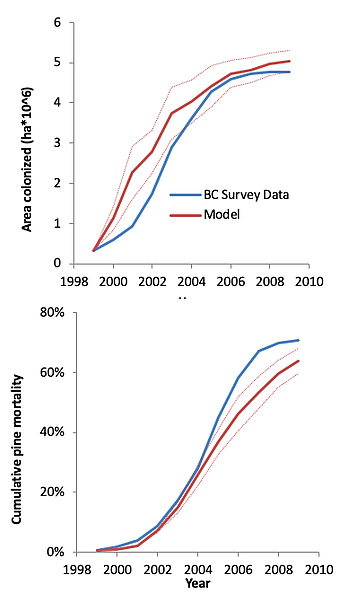
Validation Results
- The model predictions for area colonized showed good agreement with the observed data. 95% confidence intervals are shown within the accompanying figures.
- The model tended to underestimate beetle-related pine mortality but only to a small degree.
THE PROJECT RESULTS EXPLORE MULTIPLE QUESTIONS regarding the future management and spread of mountain pine beetle within novel habitat. These results form the basis of the Decision Support Tool (DST).
Q1: In the absence of control, will MPB spread across Alberta?
Model simulations suggest that in absence of StS treatment, the MPB will likely spread southward along the Rocky Mountain foothills and northeast towards Saskatchewan. View the map below to explore the potential spread of MPB without control under a normal climate by 2038.
Click here to explore the map
A graph of the total predicted area colonized by year is shown below.
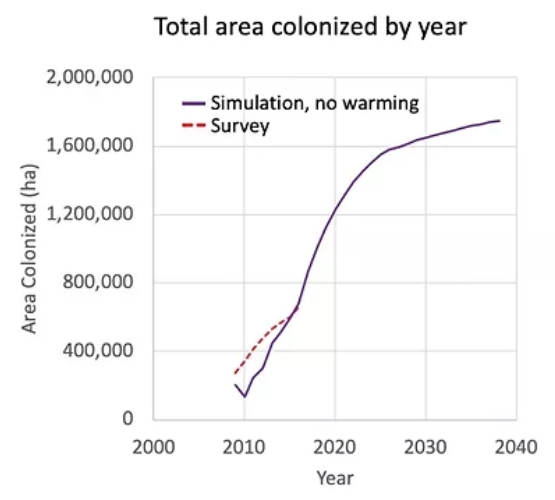
Key Observations
- Simulations included here had no StS control and assumed normal climate
- More than 1.7 million ha of pine forest area expected to be colonized through 2038
- Large areas adjacent to SK are at risk (30-40% probability) of colonization
Knowledge Gaps and Uncertainties
- We have limited understanding of beetle dynamics and spread in jack pine which is dominant in the eastern part of the province
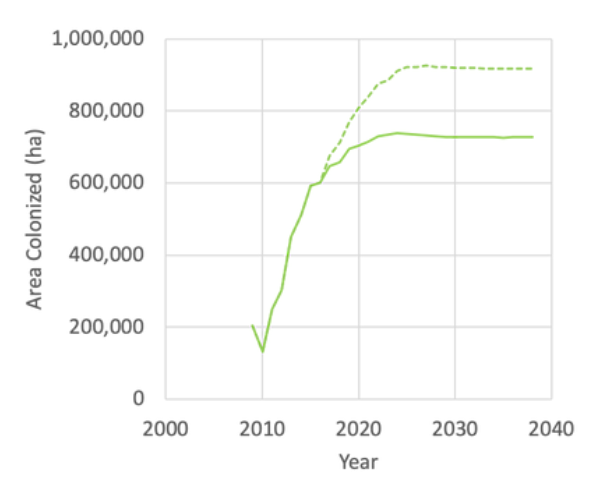
Q2: Is climate change likely to have an impact on the rate of spread?
Model simulations based on a warming climate suggest an increase in the rate of MPB spread. View the map below and toggle between the two layers [ (1) No control, normal climate, by 2038 and (2) No control, warming climate, by 2038].
Click here to explore the map
A graph of the total area colonized by climate scenario is shown in the panel below.
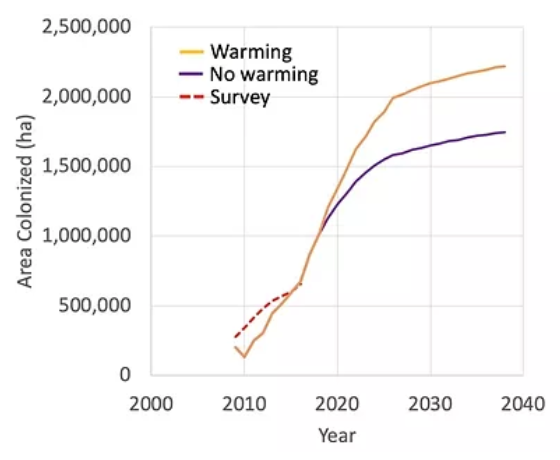
Key Observations
- Simulations included no control with a warming climate
- Warming is predicted to lead to an increase of 500,000 ha of colonized pine forests
- Larger areas adjacent to SK are at risk (40-50% probability) of colonization
Knowledge Gaps and Uncertainties
- We have limited understanding of beetle dynamics and spread in jack pine which is dominant in the eastern part of the province
- Degree of climate warming
Q3: When will MPB reach Saskatchewan?
Model simulations based on a warming climate suggest an increase in the rate of MPB spread.
Large areas adjacent to Saskatchewan are increasingly at risk of colonization (40-50% probability). One method for estimating the risk was to count the number of colonized cells (400m*400m) within 4km of the eastern border of Saskatchewan. A graph of the predicted edge-cell colonization by year is shown below.
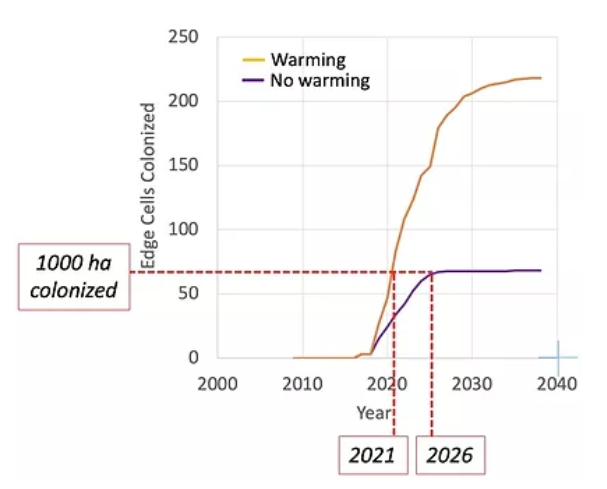
Key Observations
- Simulations included no control with a normal climate and a warming climate
- If we assume total of 1000ha (~62 cells) of edge area colonized represents a threshold for spread to SK, we can estimate the year when MPB is likely to reach SK.
- Under the normal climate scenario the beetle is expected to reach SK by 2026. This is reduced to 2021 in the warming climate scenario.
Knowledge Gaps and Uncertainties
- We have limited understanding of beetle dynamics and spread in jack pine which is dominant in the eastern part of the province
- Degree of climate warming
- Edge threshold levels
Q4: Does the slow-the-spread (StS) Strategy work?
Model simulations were conducted in which we simulated no-control scenario compared to a simulation of the current slow-the-spread (StS) management. The model was run 50 times for each scenario to determine the probability of colonization in pine forests across Alberta. View the map below and toggle between the two layers [ (1) Current StS, warming climate, by 2038 and (2) No control, warming climate, by 2038 ].
Click here to explore the map
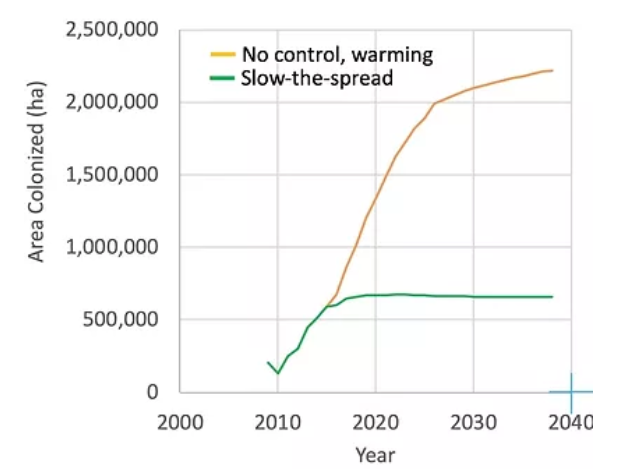
Key Observations
- Both simulations were run assuming a warming climate
- StS control led to a reduction of ~500,000 ha of MPB colonization by 2019 and ~ 1,500,000 ha reduction by 2038
Knowledge Gaps and Uncertainties
- Degree of climate warming
- The level of future investments in the spread control program
- The potential effects of limiting or restricting StS treatment in protected areas
Q5: What effect will reducing StS have on the rate of spread?
Model simulations were conducted in which we simulated no-control scenario compared several simulations with decreasing levels of the current slow-the-spread (StS) management. The model was run 50 times for each scenario to determine the probability of colonization in pine forests across Alberta. View the map below and toggle between the four layers [ (1) No Control, warming climate, by 2038; (2) Current StS, warming climate, by 2038; (3) 35% StS, warming climate, by 2038 and (4) 70% StS, warming climate, by 2038 ].
Click here to explore the map
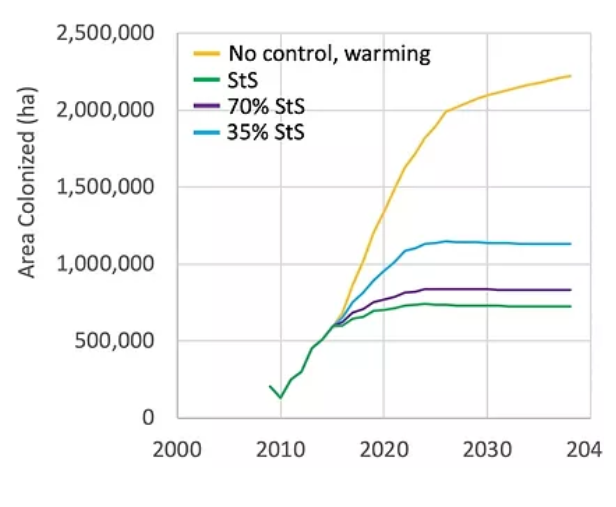
Key Observations
- All simulations were run assuming a warming climate
- The effect of reducing the level of StS treatment by 30% was relatively small
- Reducing the level of StS treatment by 65% (35% of normal) was less effective in controlling the rate of MPB spread
Knowledge Gaps and Uncertainties
- Degree of climate warming
- The level of future investments in the spread control program
- The potential effects of limiting or restricting StS treatment in protected areas
Q6: Would spread continue if StS was reduced before the collapse of the MPB population?
A scenario analysis was conducted where we compared several simulations in which the current slow-the-spread (StS) management was either continued until beetle collapse (~2038) or stopped at two different points in the future (2020 or 2025). The model was run 50 times for each scenario to determine the probability of colonization in pine forests across Alberta. View the map below and toggle between the three layers [ (1) Current StS, warming climate, by 2038; (2) StS ends in 2020, warming climate, by 2038 and (3) StS ends in 2025, warming climate, by 2038 ].
Click here to explore the map
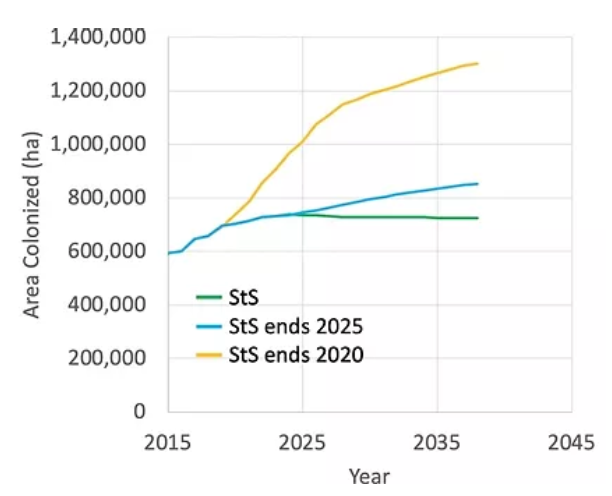
Key Observations
- All simulations were run assuming a warming climate
- MPB Spread will accelerate of STS treatment is stopped in the near future
- The model suggests that earlier abandonment will lead to significantly greater spread rates
Knowledge Gaps and Uncertainties
- Degree of climate warming
- The level of future investments in the spread control program
- The potential effects of limiting or restricting StS treatment in protected areas
Q7: What if we did more?
In a previous set of model simulations with MPB_Spread we explored the potential impact of varying levels of MPB control treatment including:
- Level 1 treatment: single tree removals — also referred to as Slow-the-spread (StS)
- Level 2 treatment: clear-cutting infestations after a significant amount of MPB-related tree mortality
These simulations were conducted starting in 2008 and running through 2018 assuming a normal climate. The results from these simulations are shown in the graph below.
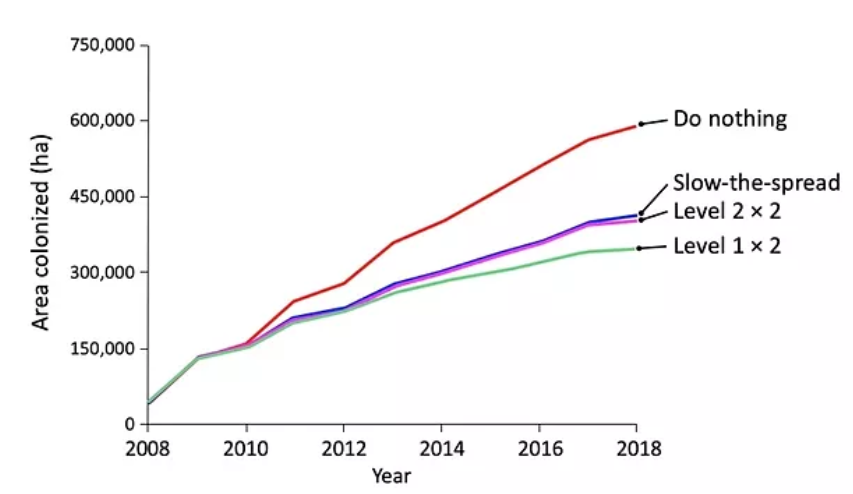
Key Observations
- All simulations were run assuming a normal climate with run times spanning from 2008 to 2018
- 2008 infestation survey maps were used to seed the model
- Level 2 treatment is not effective at controlling the spread because it tends to occur after most of the beetles have left the site
- Increased Level 1 treatments was the only technique (StS) that will significantly reduce spread rates
Knowledge Gaps and Uncertainties
- Assumptions regarding the detection rate of green attacked trees in the StS treatment method
Q8: What if control efforts focused on MPB “source” populations to the West?
A scenario analysis was conducted where we compared several simulations in which the current slow-the-spread (StS) management was either run as normal with a focus on the leading edge (from treatment prioritized from NE to SW) or alternatively where the model prioritized the western most areas first. View the map below and toggle between the two layers [ (1) Current StS, warming climate, by 2038 and (2) Western-most StS, warming climate, by 2038 ].
Click here to explore the map
A graph of the total projected area colonized by year for each scenario is shown below.
Key Observations
- All simulations were run assuming a warming climate
- Western focus results in 200,000 ha additional colonization relative to traditional leading-edge StS focus
Knowledge Gaps and Uncertainties
- Degree of climate warming
- The potential effects of limiting or restricting StS treatment in protected areas
Q9: Is there an end in sight?
To address this question we looked at a series of simulations with varying levels of StS treatment to see when the increase in colonization rates starts to flatten (see graph on the left below).
Another way to examine this trend is to look at the population of model cells that are eligible for StS treatment. Specifically, cells are eligible for treatment up to 3 years after initial colonization. After that, it is assumed that the majority of the beetle have moved on from the cell such that the expense of removing infested trees is not warranted. A graph showing the number of StS-eligible cells over time by treatment level is shown on the right below.
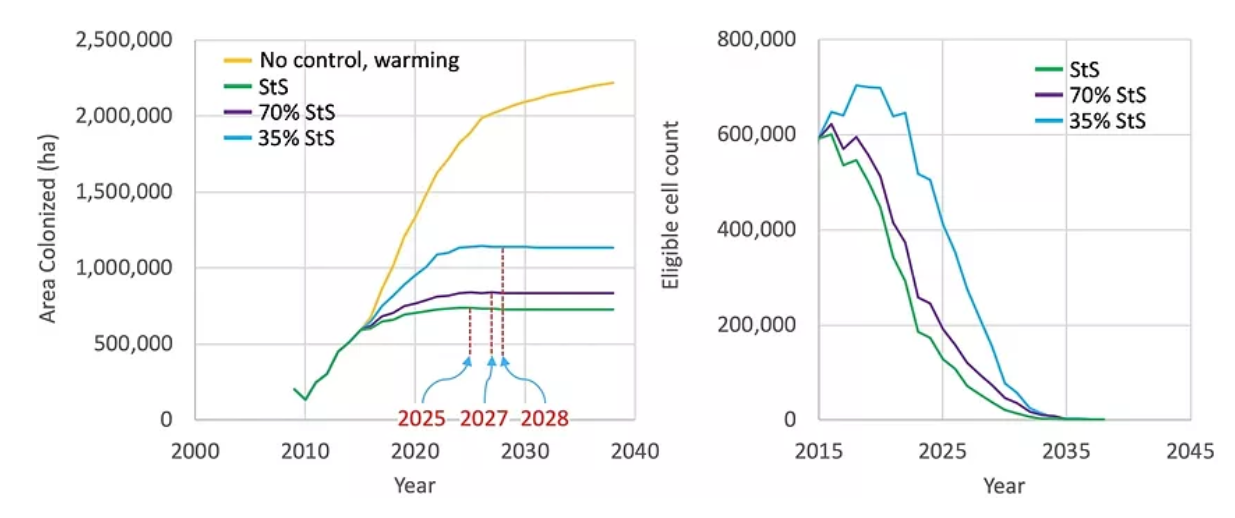
Key Observations
- All simulations were run assuming a warming climate with run times spanning from 2019 to 2038
- 2016 infestation survey maps were used to seed the model
- Under all levels of control area of colonized cells stops increasing prior to 2030 (left-side graph). This is also seen as a the number of eligible cells drops to zero prior to 2035 (right-side graph)
- Higher levels of treatment lead to earlier plateaus of colonization area
- The observed plateau is due to a decline in eligible cells
- Spread is a function of population size and habitat quality
- As populations decline (due to control and/or host depletion), so does the probability of a successful dispersal to unoccupied stands
Knowledge Gaps and Uncertainties
- Degree of climate warming
- The level of future investments in the spread control program
- Uncertainty associated with pine inventory data
For Further Information
Dr. Allan Carroll – Allan.carroll@ubc.ca
Dr Brad Seely – Brad.seely@ubc.ca
Dr Clive Welham – Clive.welham@ubc.ca
Arnold Moy – Arnoldm@mail.ubc.ca